
Relacionado: iec 62471 blue light safety led strip.
IES files contain the measured light-distribution data behind every luminaire. Learn what they are, how to open and read them, and how Lightstec tests its LED fixtures to deliver photometric reports you can design with.
When you import LED lighting from a factory or specify fixtures for a commercial project, one document matters more than most product photos: the IES file. An IES (Illuminating Engineering Society) file records how a luminaire spreads its light — where it is brightest, how it falls off toward the edges, and how many fixtures your ceiling really needs to reach a target lux level.
Lighting designers use this data every day in tools such as DIALux, AGi32 and Relux to simulate a space before a single fixture is installed. For buyers, the same file is the difference between a confident quote and an under-lit project.
No Lighttec, every luminaire we ship — downlights, track lights, linear lights and more — is measured in our own laboratory with a goniophotometer and an integrating sphere, and the results are delivered as standard IES reports. This guide explains what an IES file is, how to open and read one, and how to use the data in your next lighting design.

What Is an IES File and Why It Matters
How Lightstec Measures Light: From Goniophotometer to IES File
How to Open an IES File on Your PC
Key Sections of an IES Report
Reading the Light Distribution Curve
Using IES Files in DIALux, AGi32 and Relux
Lightstec Products With Photometric Data
Perguntas frequentes
What Is an IES File and Why It Matters?
An IES file is a standardized, plain-text photometric data file (with the .ies extension) defined by the Illuminating Engineering Society and based on the LM-63 format. It records the luminous intensity of a luminaire in candela (cd) at measured vertical and horizontal angles. When you import the file into design software, the fixture appears with its real optical behaviour — not an approximation.
Here is why the IES file should be part of every specification:
Accurate Simulation
Model the space in DIALux, AGi32 or Relux using measured data, so the result on screen matches the result on site.
Correct Quantities & Spacing
Calculate exactly how many fixtures you need to reach the required lux level — and control your project budget from day one.
Professional Documentation
Attach IES files to tenders and proposals to prove the specified fixture delivers the performance your client expects.

How Lightstec Measures Light: From Goniophotometer to IES File
A reliable IES file starts with reliable measurement. At Lightstec’s in-house testing laboratory, every fixture is verified before shipment so the photometric data you receive is the data the product actually delivers.


The goniophotometer records intensity across vertical (0–180°) and horizontal (0–360°) planes — the raw data that becomes the IES file. The integrating sphere measures total lumen output, correlated colour temperature (CCT) and colour rendering (CRI), while the oscilloscope verifies the electrical behaviour of the LED driver.


Together with industry-standard LM-79 (photometric and electrical measurement of LED luminaires) and LM-80 (lumen maintenance) testing, this gives your lighting designer everything needed for a compliant, buildable design. For a hands-on checklist of what separates quality LED fixtures from cheap ones, see our 6-step LED quality check.
How to Open an IES File on Your PC
An .ies file is plain text, so any text editor can open it. You do not need expensive software just to look inside — but avoid Microsoft Word, which can silently rewrite and corrupt the file format.
| Tool | Melhor para | Notes |
|---|---|---|
| Notepad (Windows) | Quick look at the data | Built in — open an .ies file instantly |
| Notepad++ | Reading with line numbers | Free; handles large photometric files well |
| Photometric Viewer / IES Viewer | Visualising the curve | Free tools that plot 2D/3D polar diagrams |
| DIALux / AGi32 / Relux | Design and simulation | Import the file directly into your project |
When the file is open, skim the header for the fixture name and test details, then jump to the two most useful numbers: TILT (whether the lamp was tested in its operating position) and LUMENS (total output).
Key Sections of an IES Report
A standard LM-63 IES file contains three logical parts. Once you know where to look, reading it takes seconds.
| Seção | What it tells you | Example fields |
|---|---|---|
| Part 1 — Product & test information | Fixture name, manufacturer, testing laboratory and the LM-63 standard version used | IESNA:LM-63-2002, TEST, MANUFAC |
| Part 2 — Test data header | Number of lamps, total lumens, luminous opening size, angle ranges, intensity multiplier and file units | TILT, LUMENS, CANDELA MULTIPLIER, VERTICAL ANGLES, HORIZONTAL ANGLES |
| Part 3 — Candlepower data | Intensity in candela at each measured vertical and horizontal angle | Rows of values for 0–180° vertical × 0–360° horizontal planes |
Four fields deserve special attention:
Reading the Light Distribution Curve
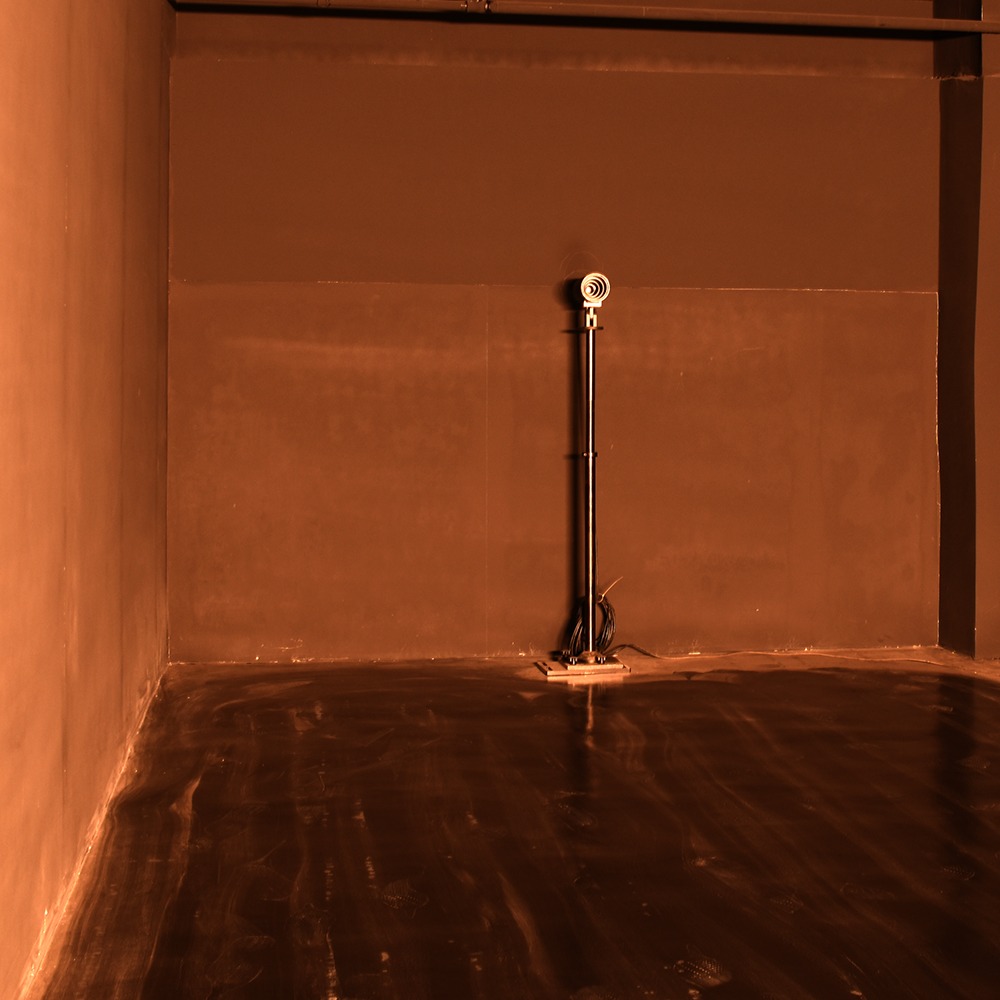
The most intuitive way to read photometric data is the polar (light distribution) curve. Concentric circles represent the angle from the fixture (0° is straight down), and the radiating lines represent intensity in candela. The further the curve extends at a given angle, the brighter the fixture shines in that direction.
Two distribution patterns appear most often in real projects:
Symmetrical Distribution
Identical intensity in all directions around the vertical axis — typical of downlights and general-purpose recessed fixtures.
Asymmetrical Distribution
More light is directed toward one side — used for wall washers, linear lights and display lighting where a beam must be aimed.
Type C Coordinates
Most indoor fixtures are measured in the Type C system (C planes rotated around the vertical axis) — the default for downlights and track lights.
Using IES Files in DIALux, AGi32 and Relux
Importing an IES file takes seconds: open your lighting design software, go to the luminaire library / import function, select the .ies file, and the fixture appears with its real photometric behaviour. Place the fixtures, set the work-plane height, and the software calculates the lux distribution across the room. When the layout is confirmed, our installation guide for LED aluminium profiles shows how to mount linear fixtures cleanly.

If your documentation requires the European format, here is the quick comparison:
| Format | Standard | Region | Extension |
|---|---|---|---|
| IES | LM-63 | North America & global projects | .ies |
| LDT (EULUMDAT) | EULUMDAT | Europa | .ldt |
Most software supports both formats. If your project spec requires LDT instead of IES, just tell your supplier — most factories, including Lighttec, can provide both.
Lightstec Products With Photometric Data
Every product below is tested in our laboratory and ships with measured IES photometric files and test reports. Click any product to view specifications and request a quote.


Perguntas frequentes
What is an IES file?
An IES file is a standardized, plain-text file that contains a luminaire’s photometric (light distribution) data, used by lighting design software such as DIALux, AGi32 and Relux to simulate how the fixture lights a space.
How do I open an .ies file?
Open it with any text editor such as Notepad or Notepad++. To see the distribution curve visually, use a free photometric viewer, or import the file directly into your lighting design software.
Does Lightstec provide IES files for its products?
Yes. Every luminaire is measured on our goniophotometer and integrating sphere, and IES files plus test reports are available on request for all downlights, track lights and linear lights.
What is the difference between IES and LDT files?
Both store photometric data. IES (LM-63) is the North American standard, while LDT (EULUMDAT) is the European format. Most design software imports both — Lightstec can provide either on request.
What are LM-79 and LM-80 tests?
LM-79 is the standard method for measuring the photometric and electrical performance of LED luminaires; LM-80 covers lumen maintenance (lifetime) of LED packages. Both are commonly requested for commercial projects.
Can I use Lightstec IES files in DIALux and AGi32?
Yes. Our files follow the standard LM-63 format and import cleanly into DIALux, AGi32, Relux and similar tools.
Need Photometric Data for Your Next Project?
Request IES files, LM-79 / LM-80 reports and a factory-direct quote. Our engineers will help you choose the right fixtures and deliver the photometric documentation your design needs.
Aprenda mais aulas ministradas por profissionais que menos pessoas lhe dirão antes de você cometer um erro.
Understanding IES test reports is essential when comparing fixtures. This article breaks down the photometric data in a way our sales team actually uses.
Practical guide on IES reports. Lightstec provides complete test documentation, which makes our job much easier. Professional and reliable — we will definitely cooperate again in the future.